Alt text
Alternative texts, i.e. alt texts, are used to convey the information contained in an image to persons who are unable to see the image itself.
How to write an alt text, i.e. a text equivalent, for a graph or image
A text equivalent or alt text is not a caption or image title
The EU directive on accessibility requires that text equivalents be provided for all non-textual online content. In other words, the information contained in images online must also be presented in text.
Alternative texts are used to convey the information contained in an image to persons who are unable to see the image itself. If the alt text is missing, screen reader programs will usually read the name of the image file. This is usually a mere nuisance for screen reader users.
The alt text is not intended to answer the question “what is in the image?” but “what should be understood from the image?”
The alternative text can be left blank in only a few cases:
- The image is question is decorative.
- The contents of the image are exhaustively described in the surrounding text. However, you should keep in mind here that it may be necessary for a visually impaired user to also be able to save the image on their own computer and e-mail it forward, for example. If the alt text is blank, screen reader users will not be able to find the image on the website at all.
- A visible caption is the same as an alt text would be.
How is an alternative text to be formulated?
- Do not focus on describing what is shown in the image, but instead think about what the purpose of the image is.
- Detail what is essential in the image in the alt text.
- Use short sentences and clear language.
- Use a period at the end of the text.
Examples
Statistical graph
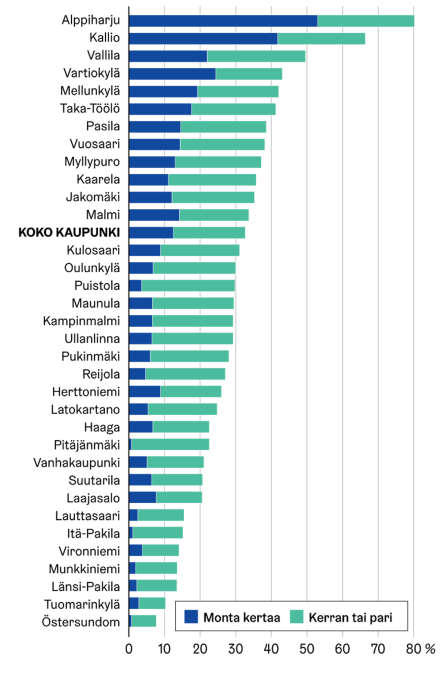
If the contents are described in the text of the page, the alt text can mention the subject of the graph in brief, and that the contents of the image are provided in text on the page.
Statistical graph: 80% of Alppiharju and Kallio residents had witnessed an assault or a fight several times or once or twice in 2018. In Östersundom and Tuomarinkylä, one in ten residents had witnessed an assault or a fight.
Map
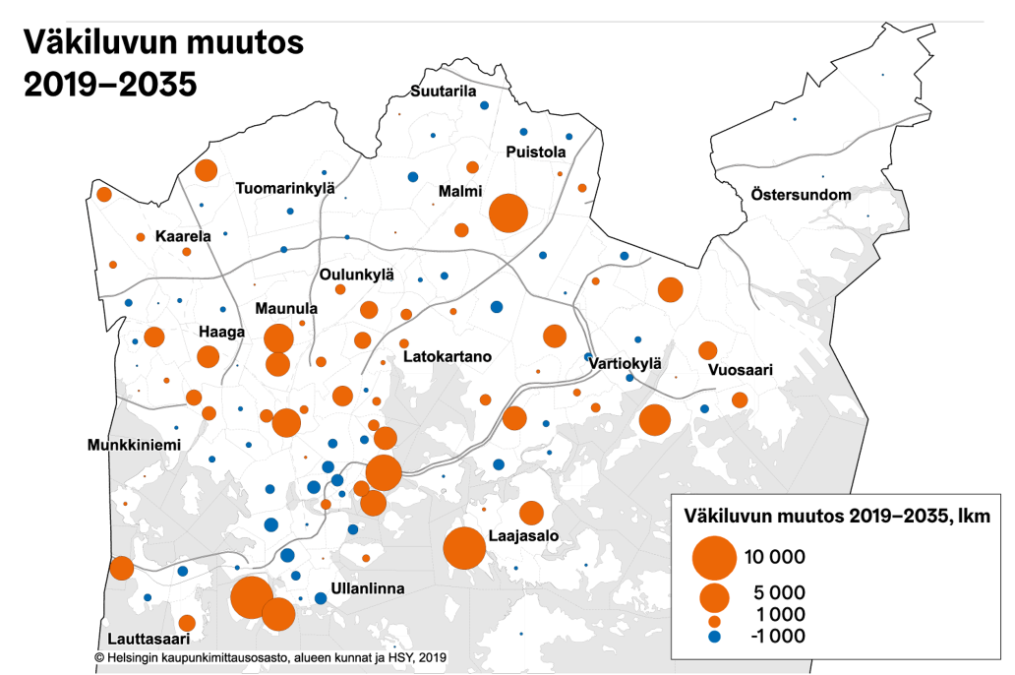
As with statistical graphs, text equivalents should be also provided for maps containing data.
Map: Population growth in 2019–2035 is expected to be at its highest in Kalasatama, Pasila, Laajasalo, Jätkäsaari, Vuosaari and Malmi. At its highest, the growth rate is
16,600 residents. There are areas in the inner city in which the population is decreasing.
Flowchart
An example of a text equivalent for a flowchart if the contents are not presented in text on the page. The entire textual content must be written in the alt text.
Flowchart: Pedagogic anticipation and preventive action. High-quality basic education: For all pupils who need support occasionally. General support: Conscious development of teaching and the operating culture. Summary: let us do things differently.
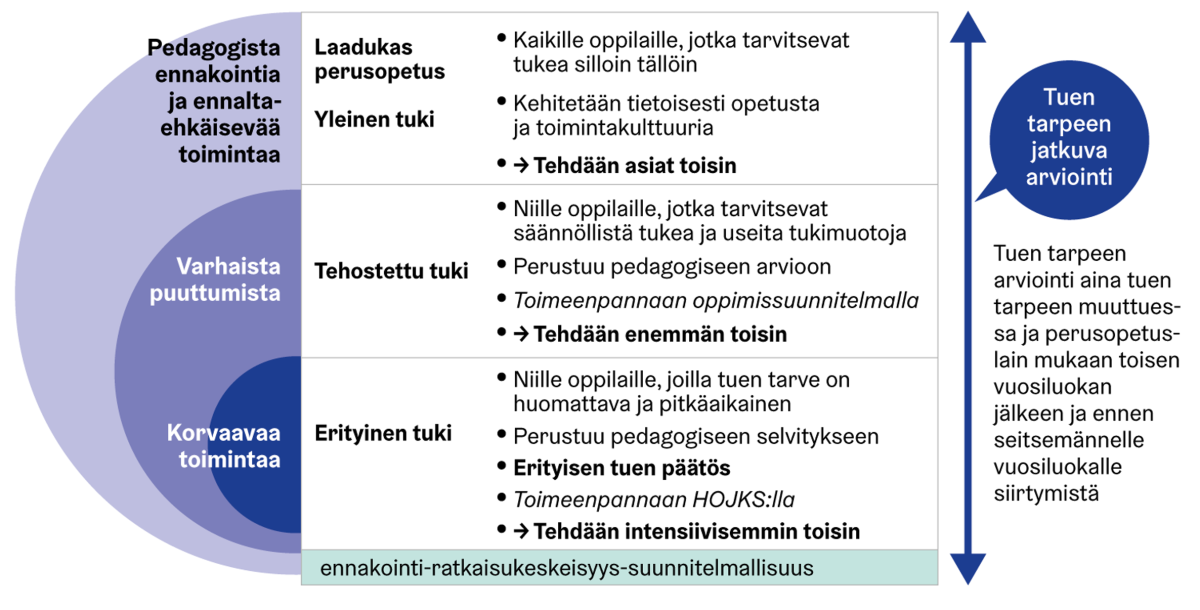
Image links on websites
Remember to provide alt texts for all image links on the website as well. One example of this is a logo link, the purpose of which is to bring the user to the front page of the service. In such a case, the alt text must not be “Logo”, but a text such as “Go to the front page.” In other words, the essential information is where the link leads.